The County of San Diego Health and Human Services Agency is updating its COVID-19 data reporting pages to provide users with a more interactive experience.
Additional graphics can help users better visualize COVID data trends over time, and the new tools allow users to choose options based on their interest.
The updated dashboard shows the number of confirmed COVID-19 cases, hospitalizations, and deaths over time. Users can choose between daily or weekly reporting data based on demographic group.
Additional data is available by hovering or clicking on various areas of the interactive charts. Information located above the graphs will help users navigate the charts. Separate links are provided to better display on mobile devices.
The website changes will result in certain reports that had been on the site no longer being available as the data are now accessible in the new format.
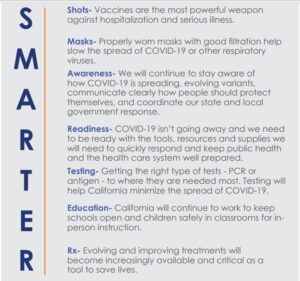
As announced last week, the updates include discontinuing the County’s Triggers Dashboard, which reported 13 surveillance, hospital capacity and public health response metrics. The County is now aligning with California’s SMARTER Plan, which state health officials are now using to respond to the COVID-19 pandemic and prepare for potential surges of the virus or new variants.
Data updates to the County’s coronavirus-sd.com website are published Monday through Friday around 5 p.m., with the exception of holidays.
Source: County of San Diego


