
Editor’s Note: This post has been updated to include the 2016 Secretary of State’s Supplement to the Statement of Vote.
The election is finally over and many people are still trying to sort out the results. According to the San Diego County Registrar of Voters, Coronado has has a total of 9,967 registered voters with the following breakdown by party (at least by those that wanted to share their affiliation):
- 44.8% – Republican
- 25.9% – Democrat
- 24.7% – Declined to State
- 4.6% – Other
But the question is, how did Coronado vote? The Los Angeles Times put together an interactive map that shows the voting results down to the precinct level. The Coronado Times took a look at the voting results of Coronado’s precincts and the results are below:
2016 Election Results : Coronado – 48% Trump, 46% Clinton (4,752 votes counted)
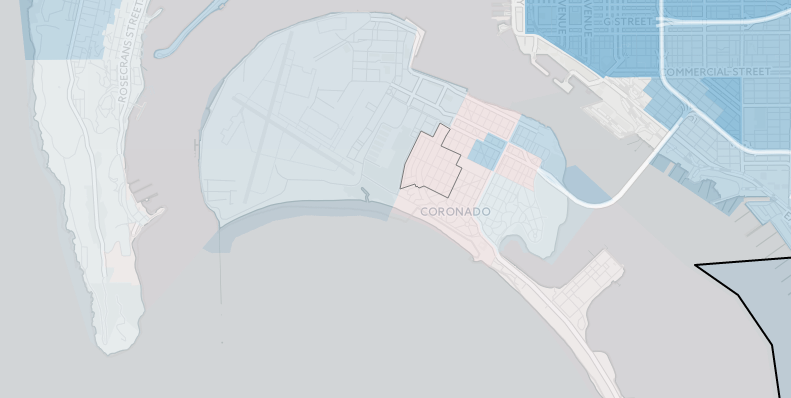
Results of Coronado’s Precincts
- West Island – 47% Clinton, 46% Trump (324-318), Johnson/Weld 5.7% (39)
- 687 Total Votes Cast
- Center – 50% Clinton, 44% Trump (169-149), Johnson/Weld 5% (17)
- 339 Total Votes Cast
- Ferry Landing – 51% Clinton, 44% Trump (187-162), Johnson/Weld 4.9% (18)
- 367 Total Votes Cast
- First Street – 49% Trump, 45% Clinton (223-203), Johnson/Weld 5.3% (24)
- 456 Total Votes Cast
- Country Club – 48% Trump, 45% Clinton (287-267), Johnson/Weld 5.6% (33)
- 594 Total Votes Cast
- 3rd Street East Corridor – 49% Trump, 45% Clinton (134-124), Johnson/Weld 5.1% (14)
- 274 Total Votes Cast
- Ocean Blvd. – 49% Trump, 48% Clinton (301-296), Johnson/Weld 2% (12)
- 614 Total Votes Cast
- Coronado Shores – 49% Trump, 44% Clinton (157-143), Johnson/Weld 6.2% (20)
- 322 Total Votes Cast
- Coronado Cays – 55% Trump, 42% Clinton (390-300), Johnson/Weld 3.5% (25)
- 716 Total Votes Cast
- 438500 3rd Street West Corridor – 48% Trump, 47% Clinton, (182-179), Johnson Weld 4.4% (17)
- 383 Total Votes Cast
Coronado Vote Total:
Trump – 2,303 (48%)
Clinton – 2,192 (46%)
Total Votes Cast – 4,752
Difference = 111 Votes
Editor’s Note: The below image has been added to include the 2016 Secretary of State’s Supplement to the Statement of Vote (page 24):
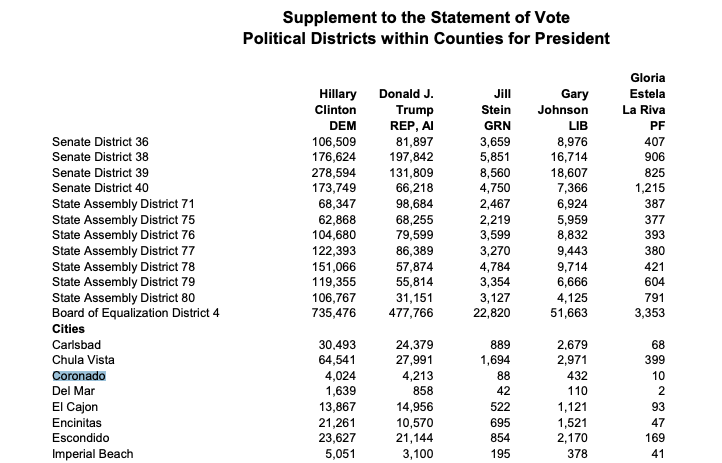
San Diego County Overall – 56% Clinton, 39% Trump* (269,422 votes counted)
*Note: Approximately 620,000 mail and provisional ballots still to be counted for San Diego County
Related: Coronado Election Results for Mayor, City Council & School Board

