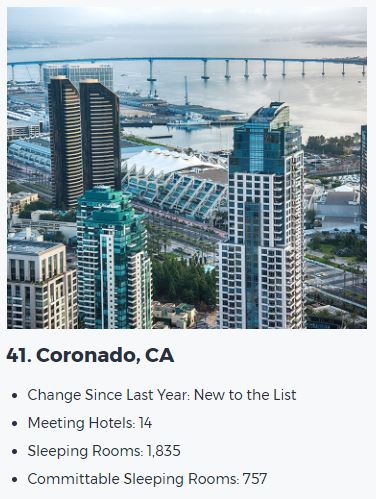
Coronado has been ranked number 41 on Cvent’s 2019 list of the top cities for meetings and events in the United States. As a new entry to the Top 50, Coronado generated $59 million in hotel revenue and created over $112 million in visitor spending.
 This year’s data was pulled across all Cvent sourcing platforms including the Speed RFP, Lanyon and the Cvent Supplier Network which features more than 255,000 hotels, resorts and special event venues – making it one of the world’s largest and most accurate databases of detailed venue information.
Cvent, a market-leading meetings, events, and hospitality technology provider, today released its annual lists of the Top Meeting Destinations for meetings and events worldwide. The lists were compiled based on meeting and event booking activity across Cvent’s venue sourcing sites, including the Cvent Supplier Network, through which more than $16 billion in business was sourced in 2018.
The annual lists include top destinations located in: United States, Europe, Caribbean & Latin America, Middle East & Africa, Canada, Germany, United Kingdom, Asia and Australia & Oceania.
“Business events add $1.5 trillion to the global GDP, and because of this positive economic impact, the cities featured in this year’s Top Meeting Destinations lists have put significant time and resources into attracting more group business to their locales,” said Chris McAndrews, vice president of marketing for Cvent Hospitality Cloud. “While the top destinations in each region have not changed significantly year-over-year, cities such as Napa, CA, Edinburgh, Scotland, and Beirut, Lebanon, are new to their respective lists and have positioned themselves as top cities to host meetings and events. Leading destinations are working closely with hotels and venues in their area to offer and promote unique experiences, helping event organizers deliver more memorable and impactful events.”
Methodology
 Cvent evaluated more than 11,000 cities worldwide featured on Cvent’s venue sourcing sites to compile the eighth annual list. Activity was tracked from January 2018 through December 2018 and destinations were ranked according to the following criteria:
- Unique Request for Proposals Received
- Total Room Nights Received
- Awarded Request for Proposals
- Awarded Room Nights
- Percentage of Qualified Meeting Venues
- Number of Profile Views
For more information, visit Cvent’s website.


