

Municipal Market Outlook by Guggenheim
Relative Value and Tight Supply
May 2014
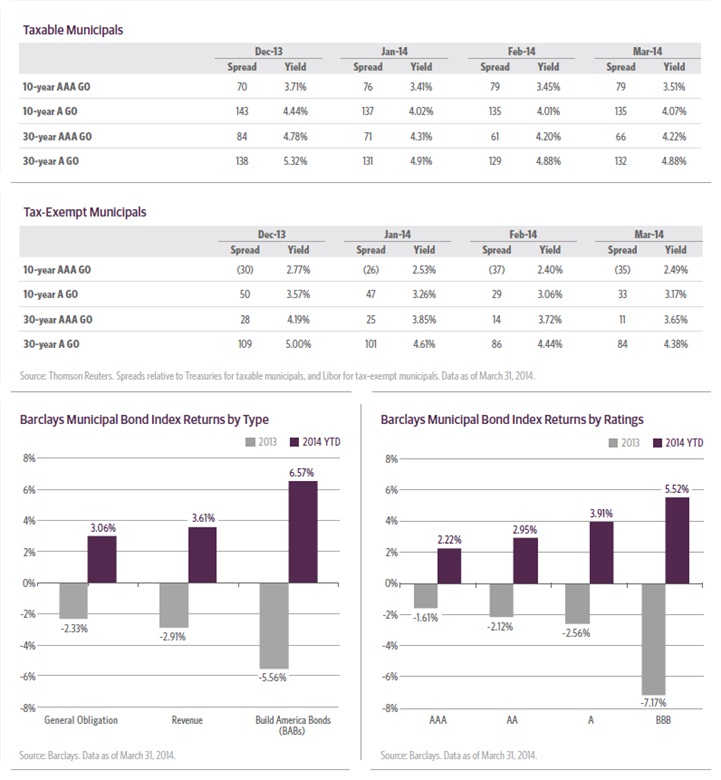
The Barclays Municipal Bond Index posted strong returns of 3.32 percent in the first quarter of 2014, outperforming the Credit Suisse High Yield Index, the Institutional Leveraged Loan Index and even some equity indices, such as the Standard & Poor’s 500 Index. Underpinning this solid municipal bond performance has been improving fundamentals at state and local governments, which have made progress fixing structural problems like pension shortfalls that have plagued issuers and curtailed market returns.
Despite these returns, municipal bond funds recorded an outflow of $1.2 billion in the first quarter. However, demand from investors should return just as supply constraints may restrict annual issuance. We expect municipal bond issuance will fall to $280-$300 billion in 2014. That would be the lowest issuance volume in a decade as annual volume has averaged over $350 billion since 2000.
We expect prices of municipals to rise further in 2014 as a result of the improved state macroeconomic outlook combined with reduced supply of municipal bonds. Some investors have avoided municipal bonds because of negative attention surrounding troubled issuers such as Puerto Rico, Illinois and Detroit. Nevertheless, we believe there is still relative value to be found in this supply-constrained environment. We find particular value in the often neglected 10- to 15-year mid-range maturity for municipal bonds.
Report Highlights
- Improving economic growth does not translate into more bond issuance: Improving economic fundamentals are unlikely to translate into additional municipal bond issuance. A combination of structural, political and technical forces will conspire to keep the overall volume of new and refunding issuance low. This should be a tailwind for prices.
- States are reluctant to issue new debt: Most major spending by state and local governments, such as Medicaid and pensions, is mandatory and has increased in recent years. As a result, states have less flexibility to meet new interest payments and have become more reluctant to issue new bonds.
- The wave of refinancing is past: Refunding high-interest debt with low-interest debt is a critical supply component of the municipal bond market. Because many of the typical candidates have been refunded already, we do not expect refunding volume to represent a significant portion of annual issuance this year.
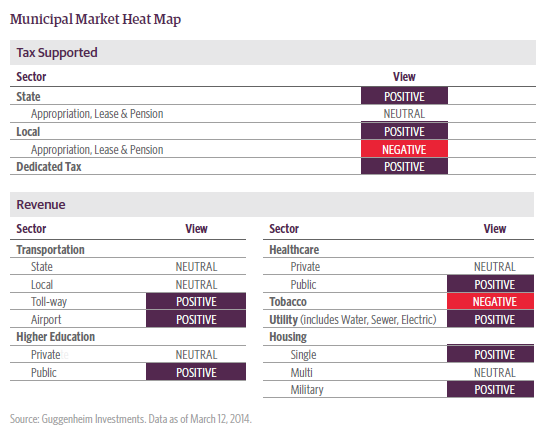
Municipal Market Scorecard
As of Month End
The Fundamental Outlook for Municipalities
Increased Revenues and Reduced Expenditures Abound
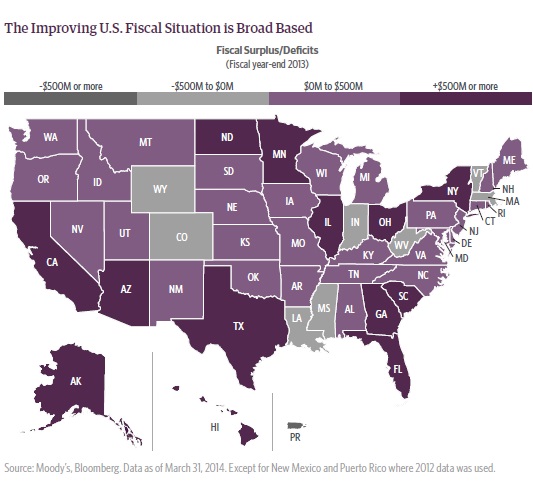
State tax collections have grown for 15 consecutive quarters and are now above their pre-recession peak, with 14 states experiencing double-digit, year-over-year increases in tax revenues for the second half of 2013. An in-depth look at the Statement of Activities the income statement for states shows a net positive improvement for a majority of U.S. states for fiscal year 2013. Most U.S. states now have surplus revenues, allowing for the replenishment of “rainy-day” funds. There has also been a shift from public to private employment that helps states. Overall, government employment fell by 3.7 percent from October 2008 to January 2013.
In the majority of U.S. states, the performance of the General Fund for fiscal year 2013 improved due to increases in revenues and a reduction of expense.
 Among local governments, the economies of all but seven of 363 metropolitan areas will grow this year, according to the U.S. Conference of Mayors. Cities are forecasting their first revenue increases since 2006, according to the National League of Cities survey, and a continued housing recovery should continue to bolster local revenues.
Improving fundamentals are reflected in reduced issuance of short-term notes. In 2013, municipalities issued $46 billion of short-term, fixed-rate notes maturing in 18 months or less, the lowest level since 2006. Municipalities typically issue notes to bridge cash shortfalls or as temporary project funding ahead of issuing longer-dated bonds. The reduction in short-term note sales suggests an improving cash flow at state and local governments.
Problem Children
New Developments for Detroit, Puerto Rico and Illinois
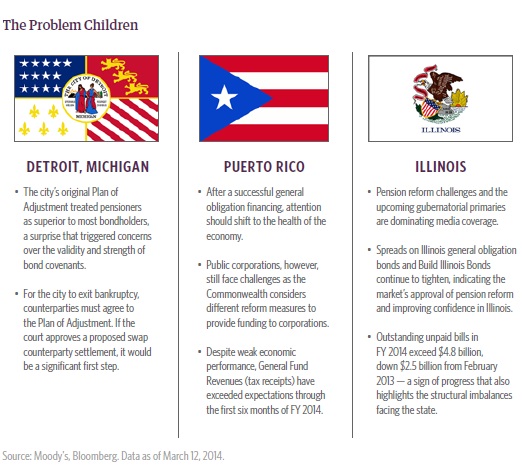
While the fundamental economic outlook for municipals is improving, sector performance and capital flows are vulnerable to headline risks from a few troubled issuers. Puerto Rico has been one such case, but its successful sale in March of $3.5 billion of general obligation bonds at 93 cents on the dollar brought much-needed liquidity to the Caribbean island.
The improvement in Puerto Rico’s fiscal situation does not mean the negative attention is over for the entire sector. Investors’ attention will likely now focus on Detroit and its various restructuring proposals, which should keep it in the headlines and should add to market volatility.
The strength of the Puerto Rico general obligation offering showed an appetite for below investment grade municipal bonds. The March 11 deal was increased by $700 million to $3.5 billion and was still oversubscribed by more than three times. In addition, the offering was priced to yield 8.727 percent, about 15 basis.
Supply Headwinds
Constraints on Municipalities Hinder Annual Issuance
U.S. states are still recovering slowly from the 2007-2009 recession, which according to the Center on Budget and Policy Priorities (CBPP) caused the greatest ever recorded decline in state tax revenues. Now, despite improving economies and recovering tax revenues, states remain reluctant borrowers, and so, municipal bond issuance this year may still be anemic.
Issuance comprises new debt and refunding. Notwithstanding the improved economic outlook and healthier state budgets, new issuance may be constrained by uncertainty over federal government funding, increasing state revenue volatility, crowding out of debt servicing by ongoing spending, and a reluctance to issue new debt ahead of upcoming gubernatorial elections. Refunding will likely be lower because low interest rates in recent years led to a surge in refinancing and also because interest rates are expected to trend higher so refunding will be unattractive at higher interest rates.
New Issuance Subdued
Crowding Out Effects
U.S. state and local governments face skyrocketing pension and healthcare costs for teachers, firefighters, police and other public sector employees. With the cost of many of these ongoing expenditures effectively on autopilot locked in place by laws or union contracts and expected to grow, the ability for municipalities to fund other projects is severely hampered. According to the State Budget Crisis Task Force, “Pension funds for state and local government workers are underfunded by approximately a trillion dollars according to their actuaries and by as much as $3 trillion or more if more conservative investment assumptions are used.”
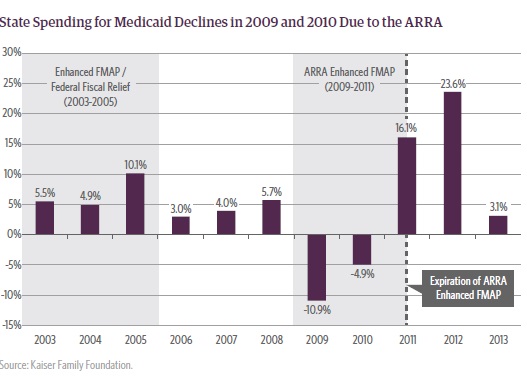
In addition to pension and public sector employee healthcare costs, Medicaid the fastest growing expense for states is consuming a larger portion of state funds. The State Budget Crisis Task Force noted that: “Medicaid programs are growing rapidly because of increased enrollments, escalating healthcare costs and difficulty in implementing cost reduction proposals. At recent rates of growth, state Medicaid costs will outstrip revenue growth by a wide margin.” Medicaid spending accounted for 23.7 percent of total state spending in fiscal 2012, the single largest component of total state expenditures, and is expected to grow to 24.4 percent in fiscal 2013. The annual average growth rate of Medicaid expenditures from 2012 to 2021 is projected to be 6.4 percent, according to the 2012 Actuarial Report on the Financial Outlook for Medicaid. Just as Medicaid expense is increasing for states, federal support to states is decreasing. On two occasions the U.S. Congress has passed temporary increases to Federal Medical Assistance Percentage (FMAP) payments. The most recent increase occurred in 2009 as part of the American Recovery and Reinvestment Act (ARRA).
The increased federal funds were a significant source of fiscal relief for states resulting in declines in state Medicaid spending in 2009 and 2010 for the first time in the program’s history. The absence of federal support led to a sharp increase in state Medicaid spending in 2011 and 2012. A strong recovery in revenues and a reduction in the unemployment rate for states moderated the effect in 2013; however, the absence of federal support will ultimately exacerbate the Medicaid funding problem for states in the coming years.
Ongoing expenses such as pension contributions, public sector healthcare and Medicaid cannot be financed by issuing tax-exempt debt, which is used to fund capital expenditures, such as public transport, schools and hospitals. The majority of debt issued by states to fund capital expenditures has fixed-rate coupons. As the share of ongoing expenditures increases, the capacity to service new debt for capital expenditures is crowded out.
Municipal issuers that are budget-constrained could use alternative forms of financing to fund capital expenditures, such as capital appreciation bonds (CABs). Unlike fixed-rate bonds, CABs do not make interest or principal payments until maturity, reducing the cash flow burden on the issuer. For example, CABs can be used to fund new schools in anticipation of future population growth and additional tax revenues. CABs, however, are politically unpopular because interest is not paid during the life of the bond, instead compounding and ultimately increasing total borrowing costs for the issuer. States such as California and Texas have proposed legislation to limit the use of CABs because they are seen as kicking the can down the road to future taxpayers.
Uncertainty of Federal Government Transfers to States Puts More Pressure on State Revenues
Federal funding for many state and local services is on track to hit its lowest level in decades. Federal funding represents about 25 percent of state revenues, but battles over the federal budget and the U.S. debt ceiling in 2013 have had spillover effects on state and local governments, leading to sharp cuts in federal funding for schools and other grants.
Additional cuts in federal funding and potential changes to the federal tax code are possible and could materially impact states’ spending. Legislators may be reticent to increase borrowing in the face of uncertainty regarding federal funding or matching grants.
Revenue Volatility Focuses States on Building Reserve Funds
Although state tax revenues have rebounded, the share of state revenue from economically sensitive and volatile sources such as personal income, sales and corporate income taxes has increased from 38 percent in 1950 to 71 percent today. The volatility of this revenue stream is higher because income tax receipts have become increasingly driven by the highest earners, whose incomes are highly correlated to financial markets because of capital gains. The increasing reliance on economically sensitive tax receipts makes states even more vulnerable to budget gaps. According to the State Budget Crisis Task Force, tax revenues declined by more than 12 percent between the 2008 and 2010 fiscal years a far greater decline than in any past recession. As a result, issuing new fixed-rate debt to finance capital expenditures will likely take a backseat to building up reserve funds to manage revenue volatility.
Gubernatorial Elections Reduce Appetite of Legislators to Increase Borrowing
There will be 36 gubernatorial elections in 2014, including the nine largest states by population. Implementation of the Affordable Care Act and pension reform is likely to be at the forefront of the political debate. Democrats and Republicans are under pressure to cut spending, lower taxes and replenish “rainy-day” funds. Although many states are projecting 2014 budget surpluses helped by higher-than-expected tax revenues, the upcoming gubernatorial elections may diminish the appetite of governors and legislators to issue new debt to fund projects.

The Bulk of Refunding Has Already Occurred
Refunding high coupon-yield debt with low coupon-yield debt is an important component of the municipal market. Without the supply from such refinancing of bonds, there would be a significant imbalance between investor demand and annual issuance. The typical refunding candidates are new money bonds sold with a 10-year call provision that are five to six years into the life of the bond with a few years remaining until the first call date. In the situation where interest rates have declined but the bonds are not yet callable, issuers can conduct an advance refunding by issuing refunding bonds and putting proceeds in an escrow account of U.S. Treasury debt until the bonds can be called. The period of low interest rates over the past five years has accelerated refunding. The proportion of refunding issuance to total annual issuance has steadily increased from 14 percent in 2000 to 42 percent in 2013.
For the remainder of 2014, the bulk of bonds that could be refunded has already been refunded. In the case of the majority of Build America Bonds issued in 2009 and 2010 (that were designed to reduce borrowing costs for state and local governments), refunding is not an attractive option because benefits to the issuer are limited. Thus, even though no Build America Bonds have been sold since 2010, the program is still influencing the municipal bond market. As a result of fewer typical refunding candidates, we do not expect refunding volume to represent a significant portion of annual issuance this year. Five years of low interest rates has accelerated refunding. For the remainder of 2014, the bulk of bonds that could have been refunded has already been refunded. For the majority of Build America Bonds issued in 2009 and 2010, refunding is not an attractive option because benefits to the issuer are limited.

Investment Implications
Credit Analysis is Still Most Important
Low historical default rates for municipal bonds present a compelling case compared to corporate default rates for bonds with similar credit ratings. However, the problems of Detroit, Puerto Rico and Illinois are a poignant reminder of the idiosyncrasies of the municipal market. One of the core principles of the municipal market the full faith and credit pledge is being debated as Detroit’s bankruptcy case moves through the courts, so while the macroeconomic tailwinds for municipals are improving, the importance of performing credit analysis remains just as vital as ever.
Positive Fundamentals Should Remain Positive
State revenues have increased for 15 consecutive quarters, and we believe they will continue to improve next quarter supported by strong tax receipts. The improving economic landscape, however, does not mean more bond issuance. We expect modest refunding volume as many of the typical refunding candidates have already taken advantage of five years of low interest rates. In addition as we discussed in this report, we expect new issuance to remain low. The positive fundamental outlook combined with an imbalance between supply and demand should produce a solid year of performance for municipal bonds.
“Riding the Curve” Enhances Relative Value Opportunities
Typically, individual municipal bond investors prefer debt with maturities of less than 10 years while opportunistic investors tend to focus on bonds maturing in more than 25 years. This barbell of investor demand often leaves debt in the middle of the range (maturing in the 10- to 15-year horizon) undervalued in particular for bonds rated in the A category. The relative value of these bonds can be gauged by looking at the ratio of municipal yields to U.S. Treasury yields, which currently exceeds historical averages. Like any other fixed-income investment, as time passes, the maturity date of a municipal bond gets closer: a 10-year bond at purchase in effect becomes a seven-year bond after three years and then a six-year bond after four years, and so on. As the investor “rides the curve” through time, that bond’s relative value should increase compared to a U.S.Treasury bond with the same maturity.
| ||
|
Important Notices and Disclosures
INDEX DEFINITIONS Barclays Municipal Bond Index is a broad market performance benchmark for the tax exempt bond market. The bonds included in this index must have a minimum credit rating of at least Baa. The referenced index is unmanaged and not available for direct investments. Index performance does not reflect transaction costs, fees, or expenses.
RISK CONSIDERATIONS Fixed income investments are subject to credit, liquidity, interest rate and, depending on the instrument, counter party risk. These risks may be increased to the extent fixed income investments are concentrated in any one issuer, industry, region or country. The market value of fixed income investments generally will fluctuate with, among other things, the financial condition of the obligors on the underlying debt obligations or, with respect to synthetic securities, of the obligors on or issuers of the reference obligations, general economic conditions, the condition of certain financial markets, political events, developments or trends in any particular industry and changes in prevailing interest rates.
The municipal bond market may be impacted by unfavorable legislative or political developments and adverse changes in the financial conditions of state and municipal issuers or the federal government in case it provides financial support to the municipality. Income from the municipal bonds held could be declared taxable because of changes in tax laws. Certain sectors of the municipal bond market have special risks that can affect them more significantly than the market as a whole. Because many municipal instruments are issued to finance similar projects, conditions in these industries can significantly affect an investment.
Municipalities currently experience budget shortfalls, which could cause them to default on their debts. A bonds market value will change in response to interest rate changes and market conditions, among other factors. In general, bond prices rise when interest rates fall and vice versa.Past performance is not indicative of future results. There is neither representation nor warranty as to the current accuracy or, nor liability for, decisions based on such information.This article is distributed for informational purposes only and should not be considered as investment advice, a recommendation of any particular security, strategy or investment product or as an offer of solicitation with respect to the purchase or sale of any investment. This article should not be considered research nor is the article intended to provide a sufficient basis on which to make an investment decision.
The article contains opinions of the author but not necessarily those of Guggenheim Partners, LLC its subsidiaries or its affiliates.
The author’s opinions are subject to change without notice. Forward looking statements, estimates, and certain information contained herein are based upon proprietary and non proprietary research and other sources. Information contained herein has been obtained from sources believed to be reliable but is not guaranteed as to accuracy. The value of any financial instruments or markets mentioned in the article can fall as well as rise. Securities mentioned are for illustrative purposes only and are neither a recommendation nor an endorsement.
Individuals and institutions outside of the United States are subject to securities and tax regulations within their applicable jurisdictions and should consult with their advisors as appropriate.
1Guggenheim Partners’ assets under management figure is updated as of 3.31.2014 and includes consulting services for clients whose assets are valued at approximately $39 billion.
2Guggenheim Investments total asset figure is as of 3.31.2014 and includes $12.9bn of leverage for assets under management and $0.4bn of leverage for serviced assets. Total assets include assets from Security Investors, LLC, Guggenheim Partners Investment Management, LLC, Guggenheim Funds and its affiliated entities, and some business units including Guggenheim Real Estate, LLC, Guggenheim Aviation, GS GAMMA Advisors, LLC, Guggenheim Partners Europe Limited, Transparent Value Advisors, LLC, and Guggenheim Partners India Management. Values from some funds are based upon prior periods.
Guggenheim Investments represents the following affiliated investment management businesses of Guggenheim Partners, LLC ( GP ): GS GAMMA Advisors, LLC, Guggenheim Aviation, Guggenheim Funds Distributors, LLC, Guggenheim Funds Investment Advisors, LLC, Guggenheim Partners Investment
Management, LLC, Guggenheim Partners Europe Limited, Guggenheim Partners India Management, Guggenheim Real Estate, LLC, Security Investors, LLC and Transparent Value Advisors, LLC. Guggenheim Partners Investment Management, LLC (GPIM) is a registered investment adviser and serves as the adviser to the strategies discussed herein. This material is intended to inform you of services available through Guggenheim Investments’ affiliate businesses.
No part of this article may be reproduced in any form, or referred to in any other publication, without express written permission of Guggenheim Partners, LLC. ©2014, Guggenheim Partners, LLC. Guggenheim Funds Distributors, LLC and Guggenheim Distributors, LLC are affiliates of Guggenheim Partners, LLC and Guggenheim Investments. For information, call 800.345.7999 or 800.

