Understanding Dimensional’s Value Proposition, Part 2 of 7: Small Cap Tilt
By Peter C. Thoms, CFA
Despite being one of the largest and fastest-growing fund companies in the U.S., Dimensional Fund Advisors (DFA) is unknown to most investors. The firm does virtually no public advertising and only permits access to its funds through investment managers with whom it chooses to partner. Thus, many investors don’t know what separates Dimensional’s investment strategies from the strategies of other fund companies.
Our series of articlesof which this is the secondendeavors to shed light on Dimensional’s strategy and explain why we believe Dimensional funds offer an excellent value proposition and are therefore worthy of consideration by all investors. We encourage investors interested in Dimensional to read each piece in this series to gain a more in-depth understanding of the firm’s evidence-based investment strategies.
Read Part 1 of 7: Value Tilt, here.
Dimensional’s equity strategies have been developed and guided by the firm’s 30-plus years of asset pricing research. The major finding of this research is that there are several attributes, or “dimensions,” exhibited by stocks that tend to go on to outperform their broad market benchmarks over time. Dimensional funds are all broadly diversified in order to reduce company-specific risk, but they are “tilted” (over-weighted) toward stocks that possess these attributes.
There are three such dimensions that the firm emphasizes when constructing equity portfolios:
- Value Premium – the tendency of value stocks to outperform growth stocks (Value stocks are stocks that trade at a cheap level relative to their book value. Growth stocks trade at expensive levels relative to their book value.
- Size Premium – the tendency of small company stocks to outperform large company stocks over time, albeit with more volatility
- Profitability Premium – the tendency for the stocks of high profitability companies to outperform the stocks of low profitability companies
This piece will discuss the Size Premium. The Value Premium piece can be read here and the Profitability Premium will be covered in a future article.
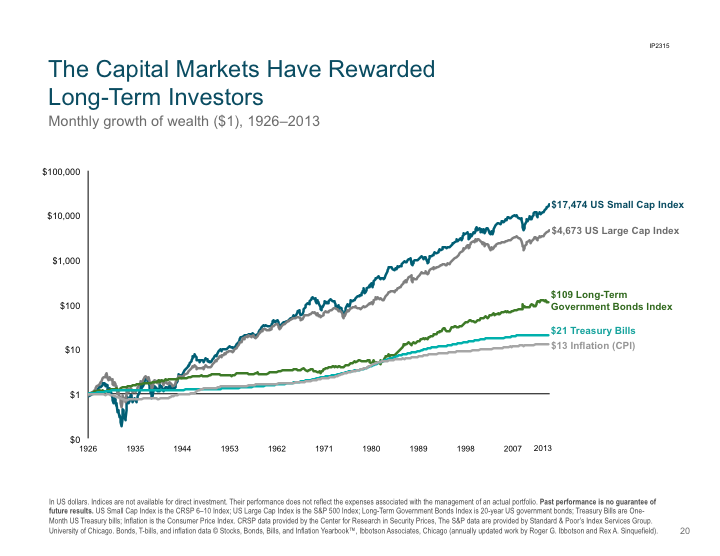
Investors putting away money for their distant future should understand a historical truth about capital markets that is displayed clearly in the chart below: that, over time, capital markets have delivered returns to investors in proportion to the risks taken. The higher the risks taken, the higher have been the long-term returns.
The logarithmic chart above shows that U.S. small cap stocks, the riskiest and most volatile category, have delivered by far the best returnsnearly four times as great as U.S. large-caps, the second place finisher. Treasury Bills, the safest and least volatile category, have delivered by far the lowest returns.
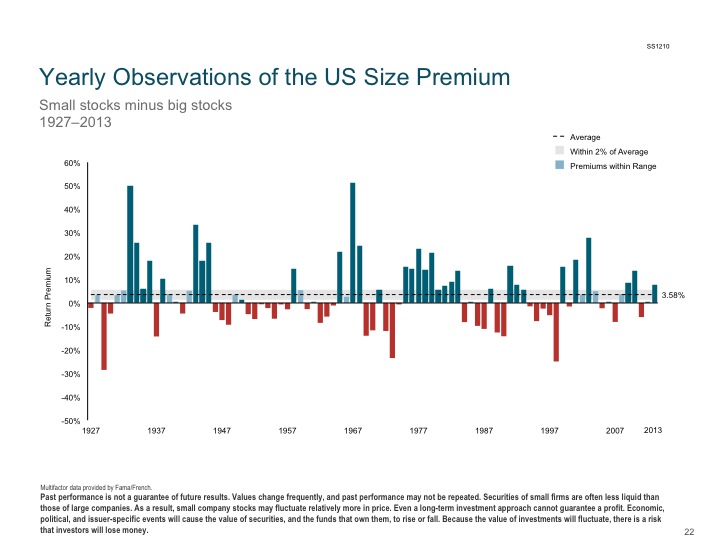
Small caps have built up their substantial advantage by, on average, outperforming large caps by only a couple of percentage points per year. By compounding returns at a higher rate over decades, small caps have opened up a massive advantage. This pecking order of returns based on risk does not hold true every yearor even every decade. However, the long term trends are clear and in fact make good financial sense: if an investor puts capital on the line in a diversified manner, he or she can expect, over time, investment returns commensurate with the riskiness of the asset class in which the capital is invested.
As the chart above makes clear, there is often a wide dispersion between the annual performance of large caps and small caps. A generalization is that small caps tend to outperform large caps in rising markets and underperform in declining markets. (One particular time period in which this was not the case was the late 1990s, when large caps outperformed significantly during a rising market.) Investors in small caps need to keep in mind that small caps’ return profile will likely differ significantly from large caps. This is good for investors, however, as owning both large and small caps in a portfolio can help with diversification.
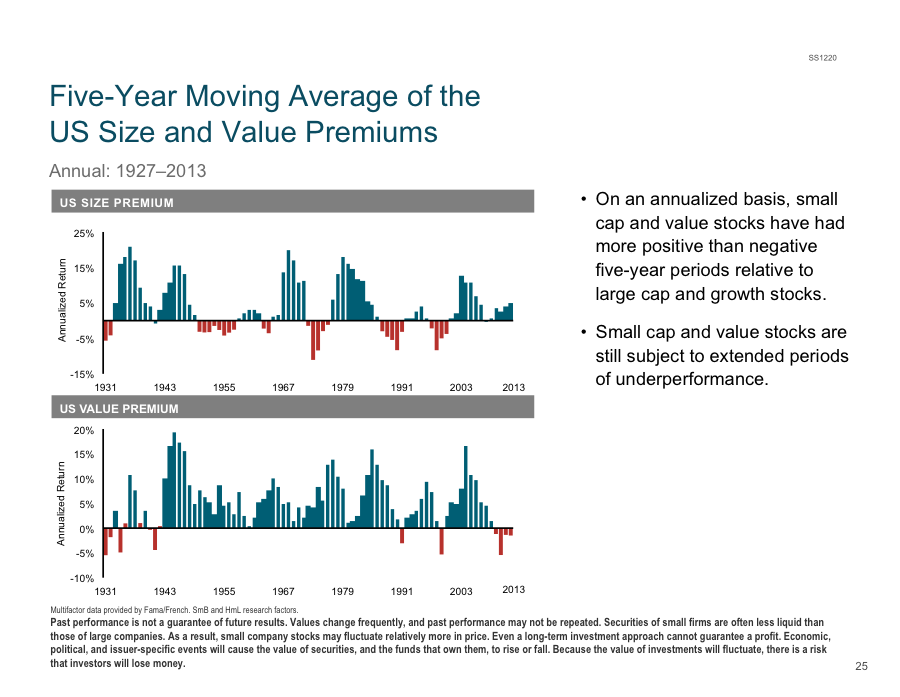
The five-year moving average chart above shows that the Value Premium (bottom graph) has, historically, been more consistent than the Size Premium (top graph). There is, however, no good reason not to incorporate both dimensions into a long-term portfolio.
For information and performance details about any particular Dimensional fund, please visit www.dfaus.com and click on “Strategies.”
To learn more about Dimensional funds and how we employ them to construct low-cost, tax-efficient, value-focused portfolios for our clients, please visit us at: www.orionportfolios.com
Peter C. Thoms, CFA
Orion Capital Management LLC
1330 Orange Ave. Suite 302
Coronado, CA 92118
Tel: 619.435.1701
Email: [email protected]
About the Author:
Peter C. Thoms, CFA, is the founder and managing member of Orion Capital Management LLC, an independent Registered Investment Advisor based in Coronado, California. The firm manages assets for individuals, families, trusts, corporate pension plans and non-profit organizations.
Disclosure:
This document is for informational purposes only. Nothing in this report is to be construed as a specific investment recommendation. This document does not constitute the provision of investment advice, which is only provided by Orion Capital Management LLC under a written investment advisory agreement and only in states in which Orion Capital Management LLC is registered or is exempt from registration requirements. Orion is not a tax advisor and does not provide tax advice. For tax advice individuals should consult their CPA.


