Stock markets dropped across the board in January, as investors reassessed their risk tolerances. driven by the Federal Reserve’s (Fed) tapering of its stimulus program, the MSCi emerging Markets index was down 6.60 percent. developed international markets, represented by the MSCi eAFe index, got hit hard as well, with a
4.03-percent decline, while the U.S. S&P 500 index slipped 3.46 percent, its largest drop in months.
Declines in emerging markets drove increased uncertainty around the world. investors sold securities, driving values for equities and bonds down.
Here in the U.S, a contributing factor to the decline was concern about the future profitability of U.S. companies. Among the S&P 500 companies that have so far reported fourth-quarter 2013 earnings, 44 guided down expectations, but only 10 guided up for optimistic growth. Fundamentals remain reasonably strong, but the prospects for future growth are becoming less certain.
January started on a very positive note for duration-sensitive bonds. the Barclays Capital Aggregate Bond index returned 1.48 percent, reversing in one month more than 70 percent of the losses it sustained during all of 2013. the
rebound underlined the diversification benefits that bonds offer.
The only fixed income sectors that struggled were globaland especially emerging market bonds. the J.P. Morgan EMBI global Core index slipped 0.85 percent, as nervous investors repatriated assets to developed markets.
U.S. Economy Shows Signs of Slowing Growth
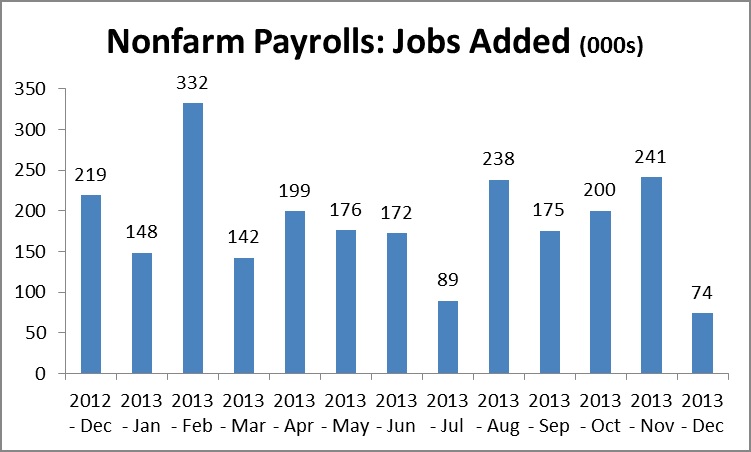
Gross domestic product figures for the fourth quarter of 2013 were relatively robustwith initial growth estimates at 3.2 percentbut there were signs of a slowing recovery at year-end. the december employment growth figure was significantly below expectations (see chart). other disappointing data points were the most recent releases of auto sales data, building permits, and housing starts. the most recent releases of business capital expenditures were weak, too, as were new home sales and durable goods orders.
Positive news included strong consumer spending data in december and a noticeable improvement in the U.S. trade balance, due largely to continued growth in domestic oil and gas production and a rebound in
consumer confidence.
Overall, these were signs of potential future weakness, rather than imminent slowdown. And, although investor expectations have also taken a hit, we still expect growth in 2014 to average in the 2.5-percent range on a real basis.
Government a Bright Spot
One principal positive difference between the start of 2014 and last year is the role of government. Unlike early 2013, we now have the certainty of a two-year budget and spending deal. Also, we have an agreement that modestly expands spending at the federal level and increases the likelihood of spending growth at the state and local levels. Moreover, government employment appears to have stabilized. the only real pending governmental risk factor is the debt ceiling negotiations in February, but it seems unlikely that we will have a major problem. With government stabilizing as a political and economic influence, private sector strength should become more apparent.
Emerging Markets and the Fragile Five
A principal external risk factor is the slowdown in emerging markets. Although the reduction in Fed stimulus is blamed for this, the real causes are the economic imbalances that the availability of cheap capital allowed to develop in those markets. nations most affected are the “fragile five”: Brazil, South Africa, indonesia, turkey, and india.
Good Fundamentals Still in Place, but Valuations Higher
As we move through 2014, the economy should continue its recovery, with growth in employment and income supporting continued progress in other areas. nevertheless, weak stock market performance around the world in January suggests that investors are reassessing their willingness to take risk and put capital to work at current valuations.
The past month’s events underline the need for a diversified portfolio and a long-term perspective aligned with investor goals.Cautious optimism remains the appropriate stance, as history has shown us that markets and economies have always returned to a growth path.

2550 5th Ave, Suite 800 San Diego, CA 92103
Phone: 619.237.9977 | Fax: 619.237.5511
All information according to Bloomberg, unless stated otherwise.
Certain sections of this commentary contain forward-looking statements that are based on our reasonable expectations, estimates, projections, and assumptions. Forward-looking statements are not guarantees of future performance and involve certain risks and uncertainties, which are difficult to predict. Past performance is not indicative of future results. Diversification does not assure a profit or protect against loss in declining markets. All indices are unmanaged and investors cannot invest directly into an index. The MSCI Emerging Markets Index is a market capitalization-weighted index composed of companies representative of the market structure of 26 emerging market countries in Europe, Latin America, and the Pacific Basin. It excludes closed markets and those shares in otherwise free markets that are not purchasable by foreigners. The MSCI EAFE Index is a float-adjusted market capitalization index designed to measure developed market equity performance, excluding the U.S. and Canada. The S&P 500 Index is a broad-based measurement of changes in stock market conditions based on the average performance of 500 widely held common stocks. The Barclays Capital Aggregate Bond Index is an unmanaged market value-weighted index representing securities that are SEC-registered, taxable, and dollar-denominated. It covers the U.S. investment-grade fixed-rate bond market, with index components for a combination of the Barclays Capital government and corporate securities, mortgage-backed pass-through securities, and asset-backed securities. The J.P. Morgan Emerging Markets Bond Index Global (EMBI Global) tracks total returns for traded external debt instruments in the emerging markets and is an expanded version of the J.P. Morgan EMBI+. As with the EMBI+, the EMBI Global includes U.S. dollar-denominated Brady bonds, loans, and eurobonds with an outstanding face value of at least $500 million. It covers more of the eligible instruments than the EMBI+ by relaxing somewhat the strict EMBI+ limits on secondary market trading liquidity.
Authored by Brad McMillan, vice president, chief investment officer, and Sean Fullerton, investment research analyst, at
Commonwealth Financial network.
© 2014 Commonwealth Financial network®


